What it means
A fair value gap (FVG) or 'imbalance' is a three-candle structure where price moves so quickly in one direction that an unfilled gap exists between the first candle's high (or low) and the third candle's low (or high). The middle candle's body spans across the gap. SMC theory treats this gap as a price 'inefficiency' — a zone where insufficient transactions occurred — that price tends to return to and fill.
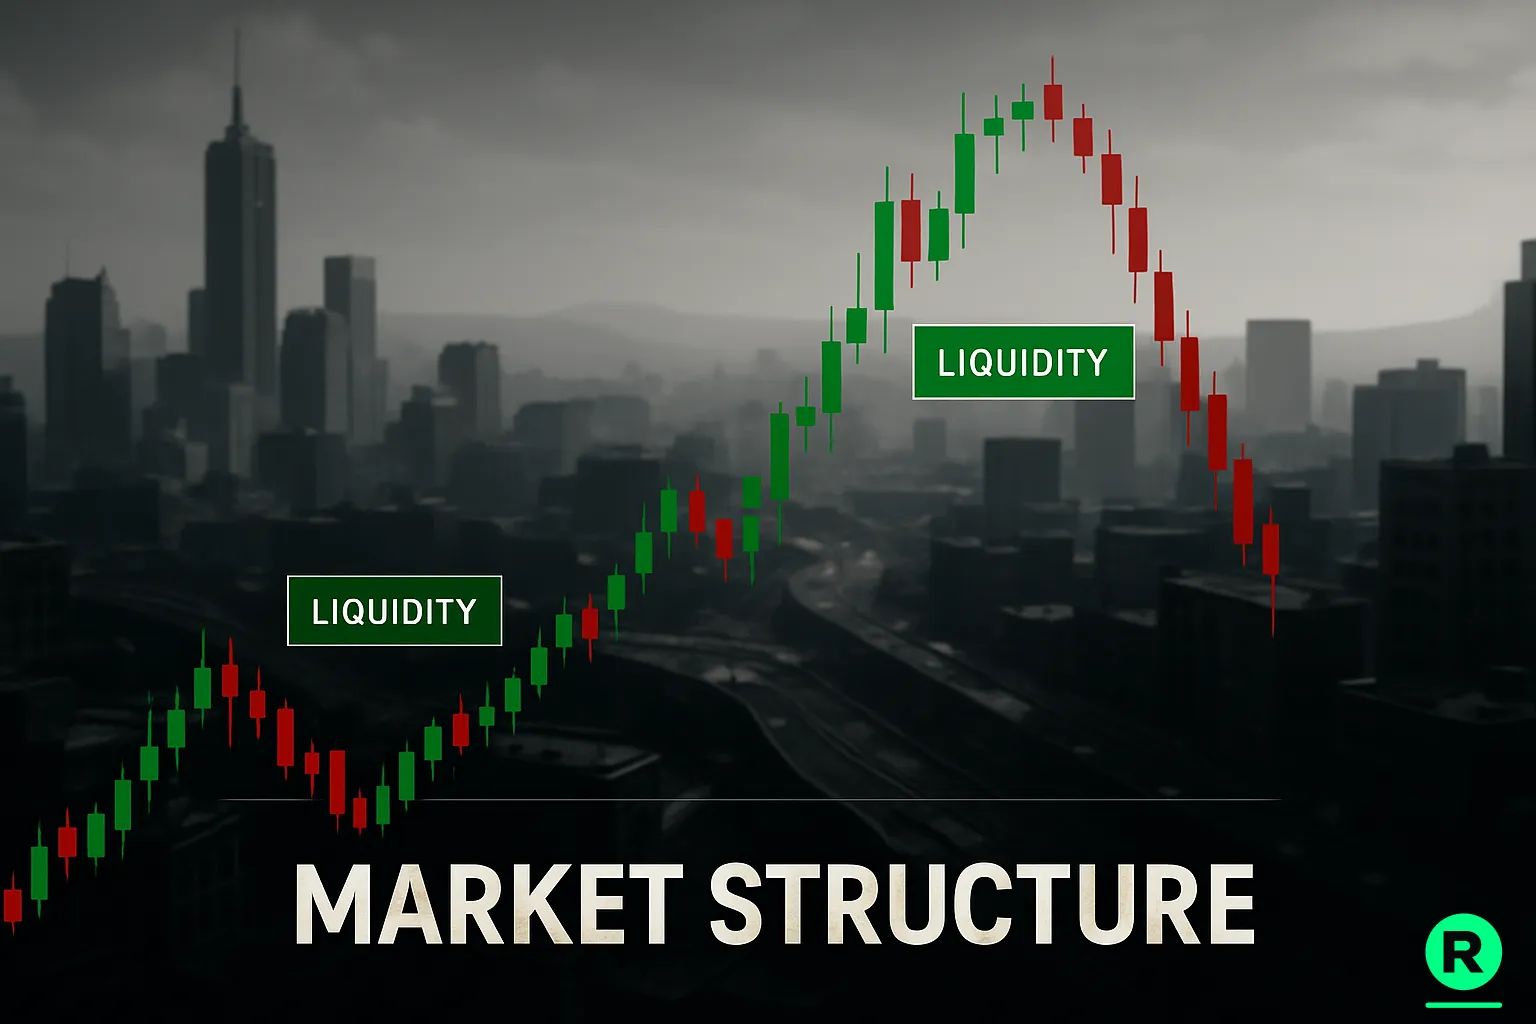
Why it matters
FVGs identify zones of rapid directional flow where buyers and sellers didn't have time to trade at every price level. The 'inefficiency' framework predicts price will return to fill the gap (mitigate the imbalance). Empirically, ~70% of FVGs see at least partial fill within 5-20 sessions of formation. Useful for entry zones on pullbacks.
How to use it
Identify FVGs after strong directional moves. Mark the zone (high of candle 1 to low of candle 3 for bullish FVG; low of candle 1 to high of candle 3 for bearish). Trade pullbacks into the FVG in the direction of the larger trend. Stop just beyond the FVG opposite extreme. Target = recent swing high/low.
ES futures Aug 2024: green candle Aug 14 (4365-4410), explosive green candle Aug 15 (4410-4480) with high volume, green candle Aug 16 (4475-4520). FVG = 4475 (Aug 16 low) to 4410 (Aug 14 high). Pullback Sept 6 entered the FVG at 4475 and rejected, rally continued to 4630.
Three FVG types — bullish, bearish, and balanced
(1) Bullish FVG: middle candle is strongly bullish; gap exists between candle 1's high and candle 3's low (price moved up so fast the candles don't overlap). (2) Bearish FVG: middle candle is strongly bearish; gap between candle 1's low and candle 3's high. (3) Balanced/inverted FVG: the structure exists but in a smaller form — less actionable. The strength of the middle candle (size of its body) directly correlates with FVG reliability — larger middle candles = larger imbalance = stronger zone.
FVG fill rates — what to actually expect
Empirical patterns: ~50% of FVGs fill partially within 5 sessions, ~70% fill at least partially within 20 sessions, ~85% fill within 50 sessions. Full fill (price closes the entire gap) is less common (~60% within 50 sessions). The fill rate is much higher for FVGs in the OPPOSITE direction of the larger trend — markets tend to mitigate counter-trend imbalances more reliably than trend-aligned ones.
Frequently asked
How is FVG different from a price gap?
A 'price gap' in classic charting is a discontinuity between sessions (the next session opens away from the prior close). FVG is intra-session — the gap is between candle wicks within a continuous price series. FVGs occur in continuous markets (FX, crypto, futures) where traditional gaps are rare.
Do FVGs always get filled?
Most do (~85% within 50 sessions) but not always. FVGs in strongly trending markets can remain unfilled for months — strong trends ignore mitigation. As a trade signal, FVG fill is high-probability but not certain.
Should I trade ALL FVGs?
No. Filter by trend context: trade FVGs that are pullbacks against the prevailing higher-timeframe trend (the FVG is in the OPPOSITE direction of the larger trend). Trade FVGs that align with structural levels (order blocks, prior swings). Trading every FVG mechanically produces too many false signals.
What timeframe works for FVG?
Higher timeframes (daily, 4H) produce fewer but more reliable FVGs. Lower timeframes (15m, 5m) have many FVGs but most fill quickly and don't provide meaningful trade signals. Most SMC traders work 4H/daily FVGs with entries on 15m.
Want a worked example or a deeper dive? Ask Rocky how this concept applies to your specific watchlist or trade idea.
Ask Rocky